sealand
sealand(f1::Function, arg1, t1::NamedTuple, f2::Function, arg2, t2::NamedTuple; kw...)

and

terramar(f1::Function, arg1, t1::NamedTuple, f2::Function, arg2, t2::NamedTuple; kw...)
The sealand/terramar pair of functions is intended to simplify the task of mapping one field (grid or image) at the ocean side and another different field (also a grid or image) over land. To achieve this result, we resort to the coast module and its ability to clip the dry and wet parts of the Earth. In the first function, sealand, we pass first the module name and the data that is going to be plotted over the oceanic areas, and second the module and data over land. The second function, terramar does the opposit.
f1: The name of the module that will be used to plot the data. Normally, this should be either grdimage or grdview, but plot can in principle be used as well.arg1: The input data to be used by thef1module. Normally, a GMTgrid a GMTimage, a GMTdatset or a string with the file name of the data to use.t1: A NamedTuple with the keyword=value pairs of the options to be consumed byf1.f2: Likef1but to be applied toarg2.arg2: Likearg1but forf2.t2: Liket1but forf2.
Other than the above options, we can pass in kw options to be consumed in the coast module and that will result in, for example, plotting the coastlines with pen color, thickness, style, etc... controls. Use it also to instruct this program to finish the figure and display it (the familiar show=true), or to save the figure under a different name/format, e.g. figname="blabla.pdf".
Examples
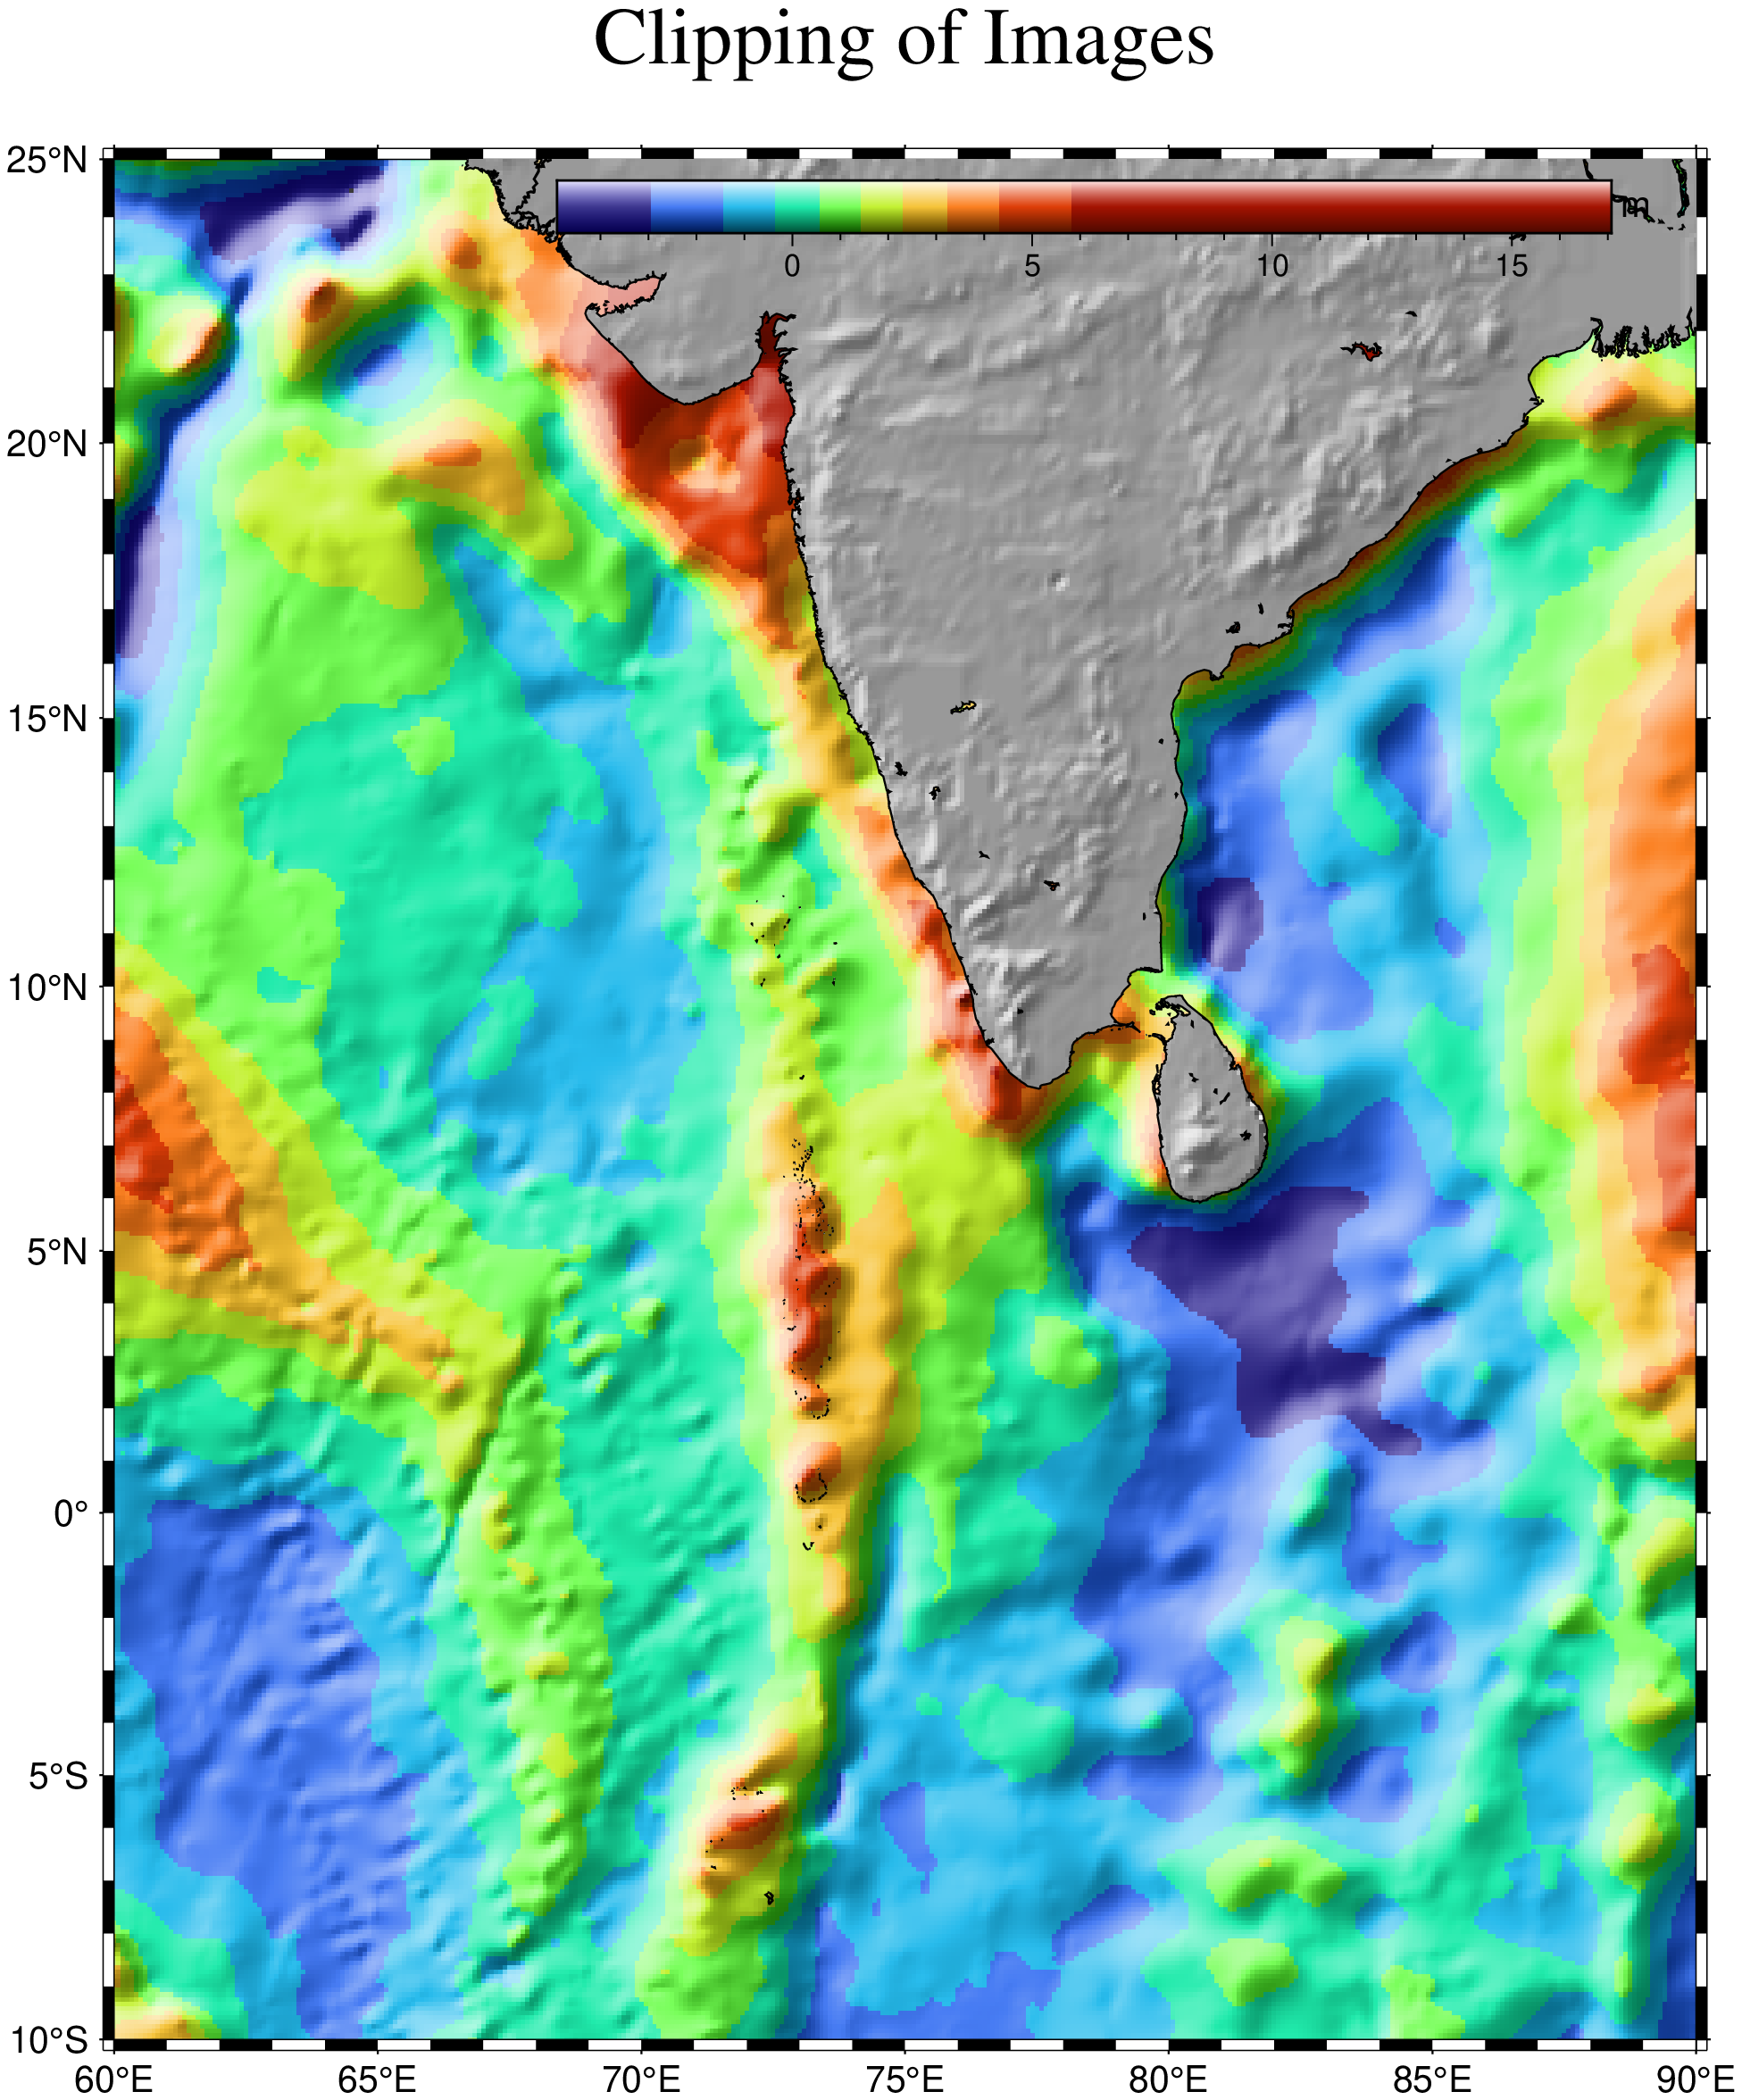
Reproduce the GMT Illustration Gallery example 17.
using GMT

Cgeoid = grd2cpt("@india_geoid.nc");
Cgray  = makecpt(cmap=150, range="-10000,10000", nobg=true);
sealand(grdimage, "@india_geoid.nc", (region="@india_geoid.nc", shade="+d", proj=:Merc,
                                      cmap=Cgeoid, title="Clipping of Images"),
        grdimage, "@india_topo.nc", (shade="+d", cmap=Cgray), shore=0.5)
colorbar!(pos=(inside=true, anchor=:TR, offset=(0.8,0.2), size=(10,0.5), horizontal=true),
          cmap=Cgeoid, xaxis=(annot=5, ticks=1), ylabel=:m, shade=true, show=true)
See Also
coast, grdimage, grdview, plot
These docs were autogenerated using GMT: v1.33.1